Factor Graph
In the propagation of information, we are usually dealing with such relations that some system (factor) $ f$ is related to some inputs (variable) $ x$.
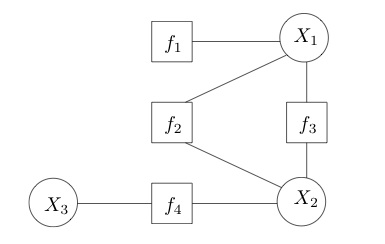
Factor graph builds such networks of relations. In such a graph, we use boxes to represent factors, and circles to represent variables.
Suppose we need to find out the probability of factor $ f_4$, we have to take in the two variables $ X_2$ and $ X_3$.
One important question is that we can actually calculate the probability of a specific configuration of the variables, which is
$$ P \propto f_1(X_1) + f_2(X_1,X_2) + f_3(X_1,X_2) + f_4(X_2,X_3). $$In general, we can assign weights $ w_i$ to each factors $ f_i$, so that the probability of each set of variables is
$$ P(X_1,X_2,X_3,X_4) \propto w_1 f_1(X_1) + w_2 f_2(X_1,X_2) + w_3 f_3(X_1,X_2) + w_4 f_4(X_2,X_3). $$The normalization is the partition function, i.e., the summation of all the possible combinations of variables,
$$ Z = \sum_{\{X_1,X_2,X_3,X_4\}} P(X_1,X_2,X_3,X_4). $$As an example, we consider $ X_i$ is 0 or 1. The combinations are (partially) listed below.
List of Possible Configurations of Variables
| $ X_1$ | 0 | 1 | 1 | 1 | … | |
| $ X_2$ | 0 | 0 | 1 | 1 | … | |
| $ X_3$ | 0 | 0 | 0 | 1 | … | |
| $ X_4$ | 0 | 0 | 0 | 0 | … |
References and Notes
Lei Ma (2020). 'Factor Graph', Intelligence, 10 April. Available at: https://intelligence.leima.is/toolbox/random-thoughts/factor-graph/.